Research
The SCAMs@bristol research group is principally a method-development group, working at the interface of chemistry and applied mathematics. Currently, our work is focused on three (interlocking) areas:
Things Moving
We are interested in understanding how and why atoms and molecules move in a chemical system. This involves combining experiment and chemical simulation to probe the atomic and molecular motions. Specifically, we use (quasi-elastic) neutron scattering together with molecular dynamics simulations to produce experimentally-verified molecular movies. Recently, we have become particularly interested in ideas around collective motion, where the motion of one particle influences others.

Particles may influence each other to affect their motion.
Fun Maths
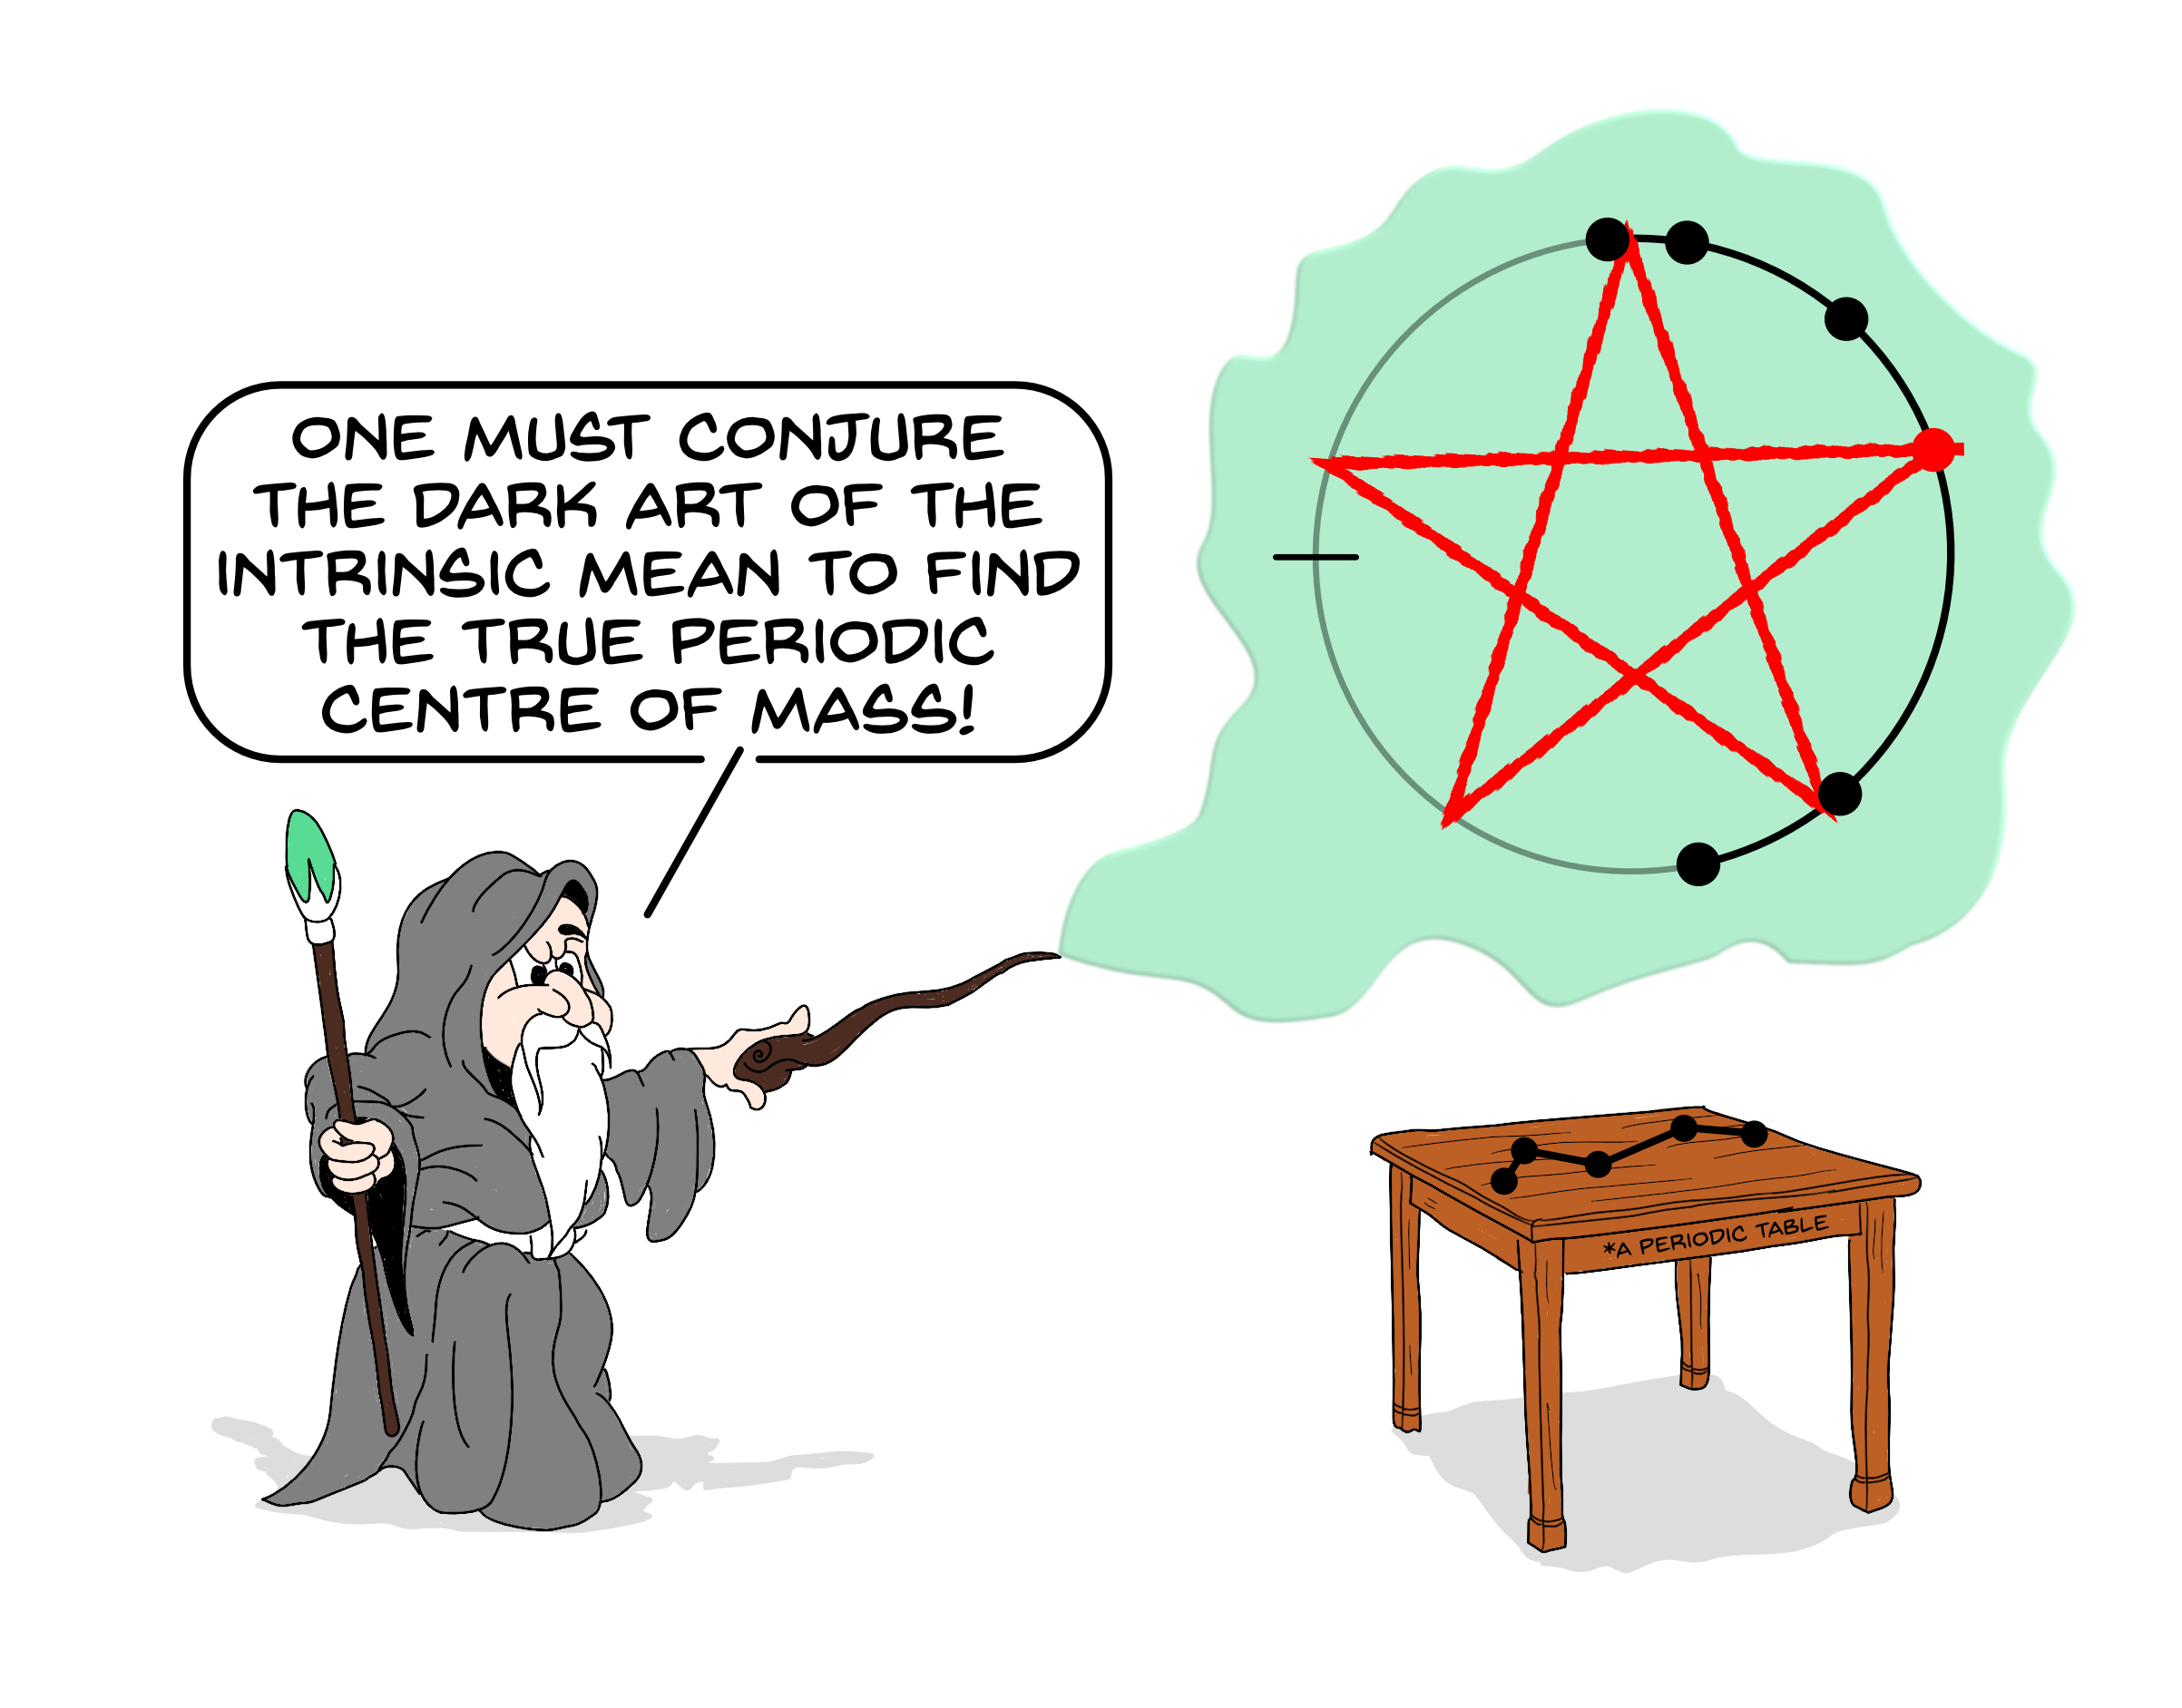
To ensure that the information we get from our experiments and simulations is of the best quality, we frequently develop new and improve existing analytical approaches. To achieve this, we take advantage of interesting and novel topics from maths and statistics. This topics include Bayesian regression, model selection, and directional statistics.

Some aspects of improving accuracy feel like the dark arts.
Better Chemistry
The goal of any chemical measurement is to gain some insight into a physical observable. However, the process of making a measurement is a noisy channel, i.e. there is information loss in the measurement process. This means that our data will not contain all of the information that is present in the original observable. The goal of any data analysis is then to try and reconstruct the physical observable (to decode the signal, in information parlance), leading to a fuzzy, noisy estimate. We work with traditional chemists to take advantage of data science methods to improve their reconstruction and, therefore, get a better understanding of their observable.
